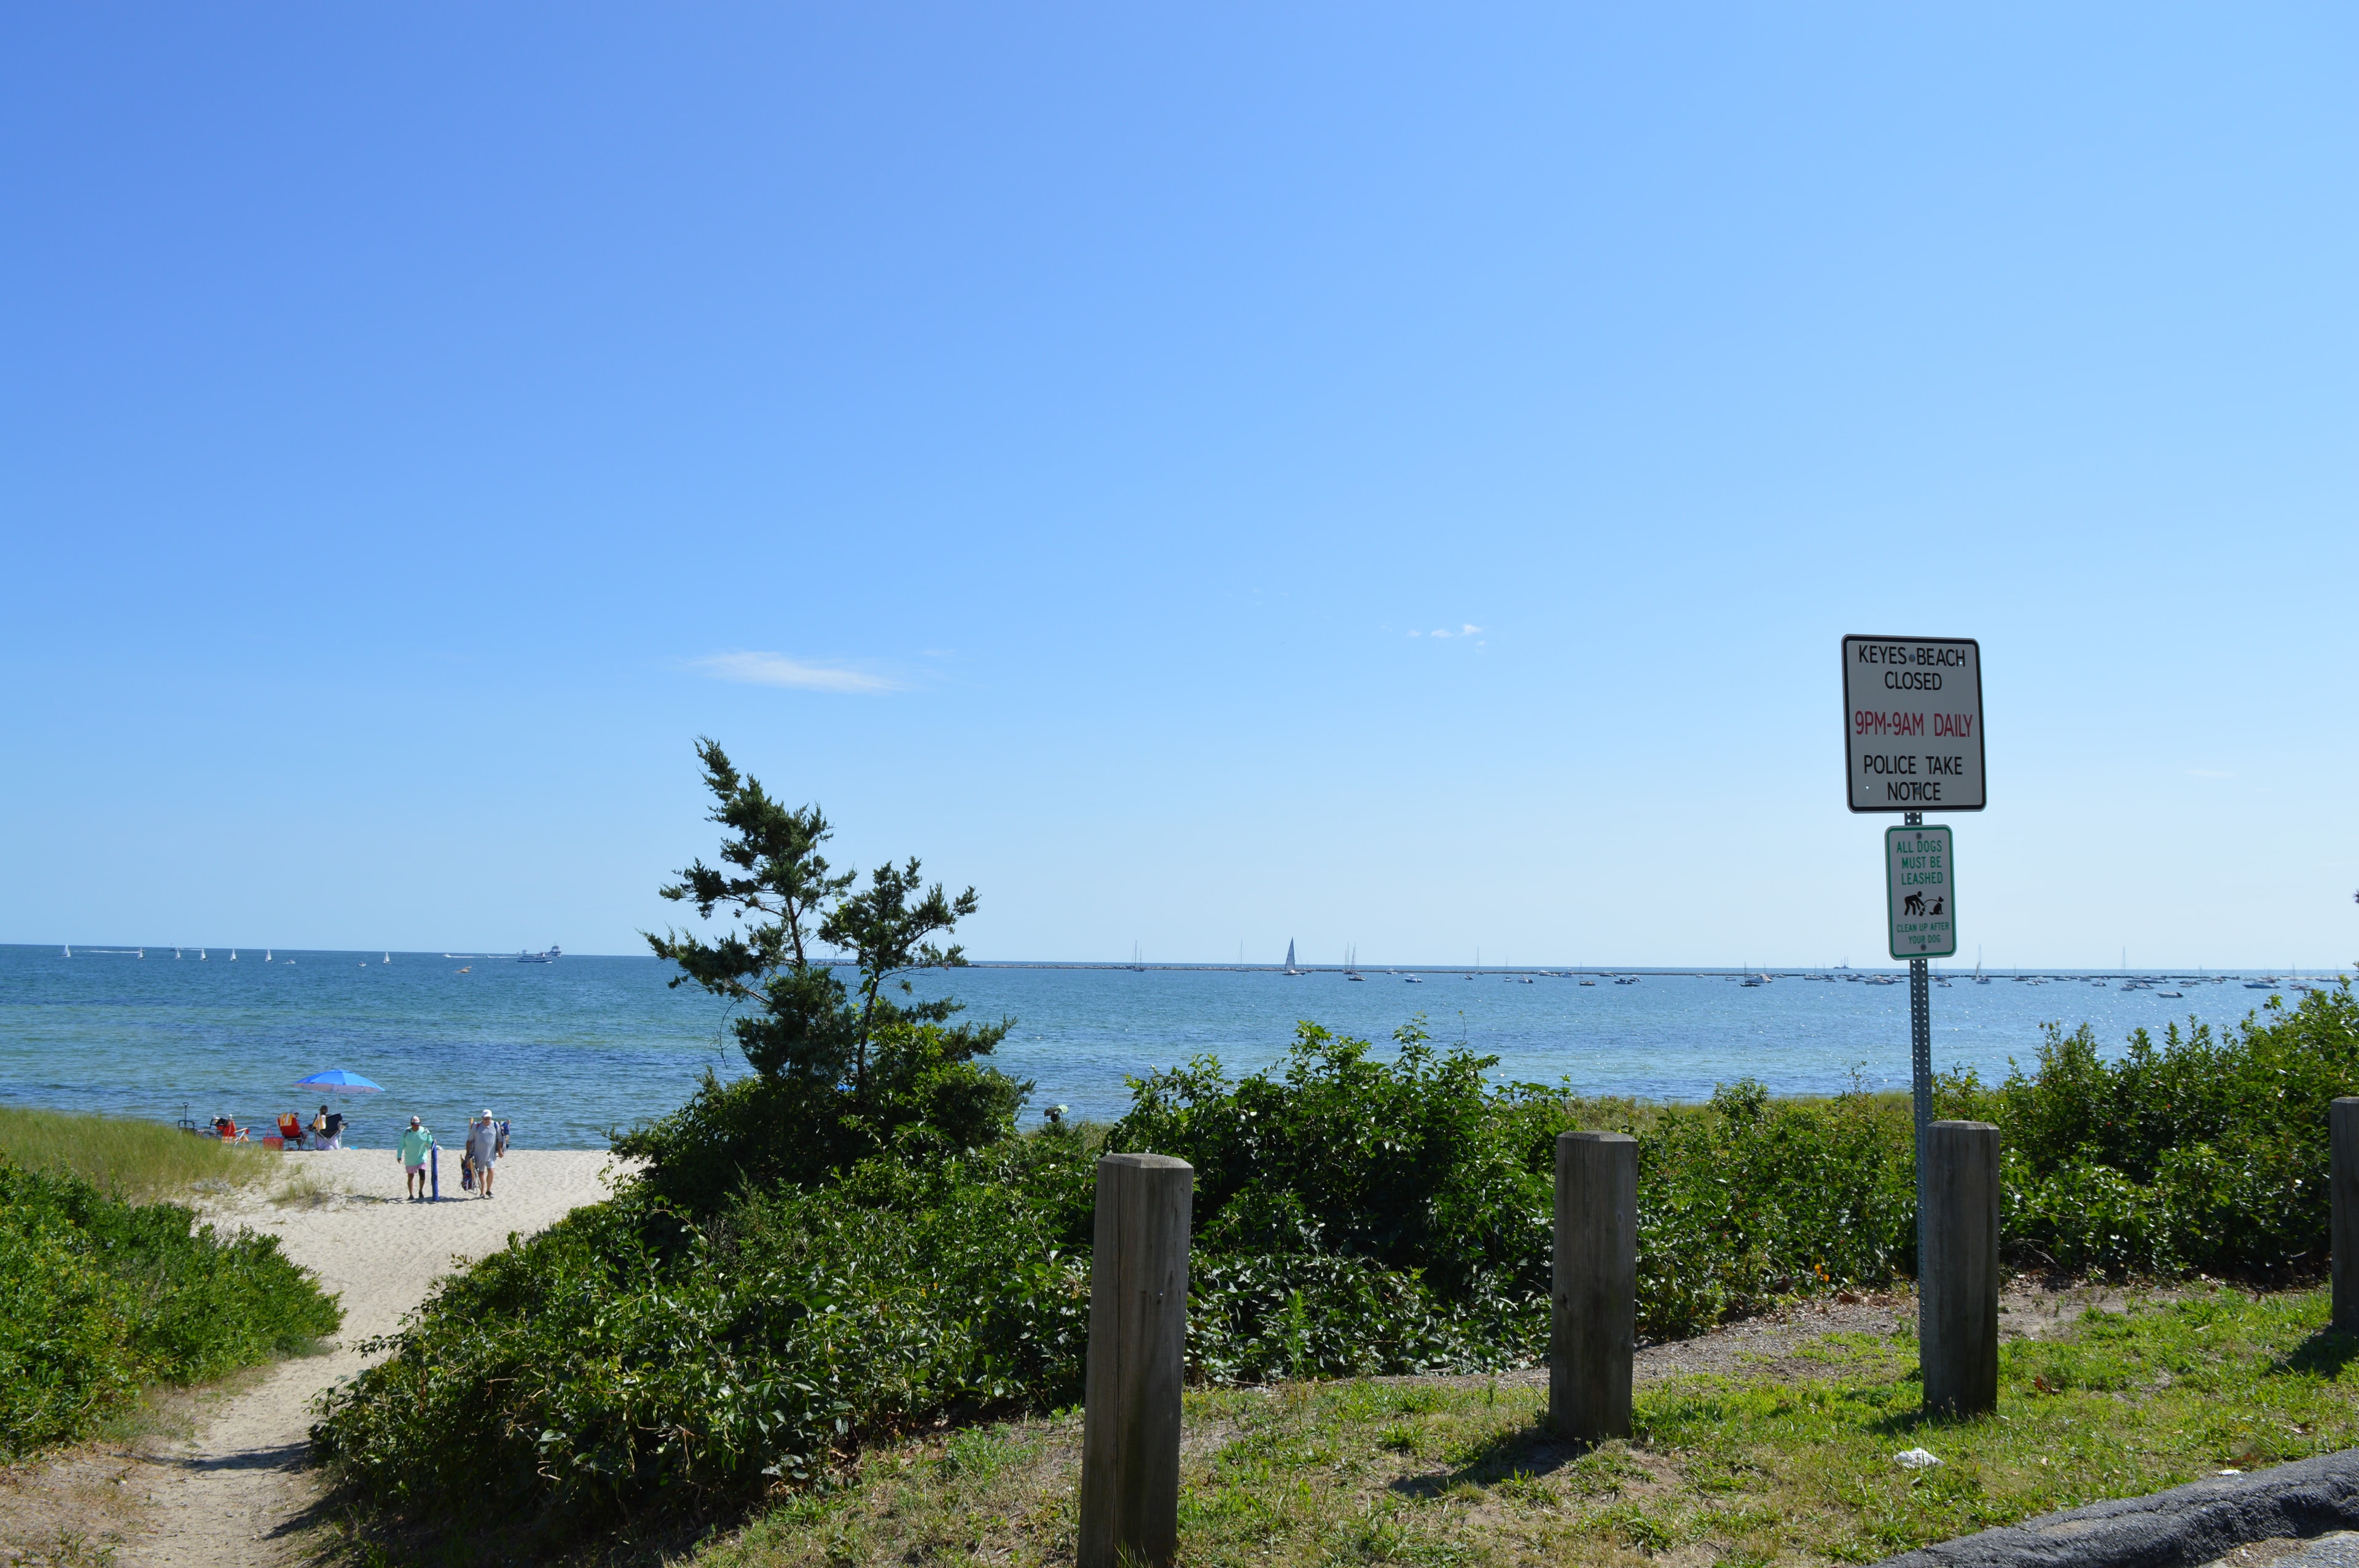
After a sluggish June, the Barnstable real estate market showed signs of renewed momentum in July 2026. Closed sales rose to 60 transactions — up 15.4% from 52 in July 2025 — while pending contracts jumped to 65, a 22.6% increase year-over-year. New listings also climbed sharply, with 60 new properties hitting the market compared to just 45 a year ago, a 33.3% surge that gives buyers meaningfully more to choose from heading into late summer.
The median sale price came in at $712,500, down 9.75% from $789,500 in July 2025 — a notable dip that reflects both a shift in the mix of homes closing and continued buyer resistance to elevated asking prices. The average sale price held nearly flat at $1,265,797, down just 0.41% from $1,270,953 a year ago, suggesting the luxury end of the market remained active.
All data is sourced directly from Cape Cod & Islands MLS activity for the town of Barnstable. Here's our full breakdown.
$712,500
-9.75% vs July 2025
$1,265,797
-0.41% vs July 2025
44 days
-13.7% vs July 2025
3.13
-8.21% vs July 2025
Transaction Volume Picks Up Across the Board
The most encouraging signal in the July data is the broad-based increase in transaction activity. Closed sales, pending contracts, and new listings all rose year-over-year — a combination that points to a market finding its footing after a slow spring.
The 22.6% jump in pending contracts to 65 is particularly telling. Pending sales are a leading indicator — they reflect buyer decisions made in the prior 30–45 days — so this surge suggests that August closings should be solid. Active inventory fell to 142 listings, down 13.9% from 165 in July 2025, which means the market is absorbing new supply faster than it's accumulating it.
| Category | Jul '26 | Jul '25 | % Chg | YTD '26 | YTD '25 | % Chg |
|---|---|---|---|---|---|---|
| Sold Listings | 60 | 52 | +15.4% | 319 | 333 | -4.2% |
| Pending Listings | 65 | 53 | +22.6% | 366 | 355 | +3.1% |
| New Listings | 60 | 45 | +33.3% | 466 | 461 | +1.1% |
| Active Listings | 142 | 165 | -13.9% | 565 | 570 | -0.9% |
Source: Cape Cod & Islands Association of REALTORS® MLS, July 2026.
Median Price Pulls Back; Asking Prices Climb Higher
The median sale price of $712,500 represents a 9.75% decline from July 2025's $789,500 — the sharpest year-over-year drop we've seen in recent months. This doesn't necessarily mean homes are worth less; it more likely reflects a shift in the composition of closings, with fewer high-end transactions closing in July relative to a year ago.
The YTD median sale price of $710,000 is essentially flat — down just 0.14% from $711,000 through the same period in 2025. That stability over seven months tells a more reliable story than any single month's figure: the Barnstable market is holding its value, even as individual months fluctuate.
On the asking-price side, sellers remain ambitious. The median list price for active inventory reached $989,500 in July — up 13.09% from $875,000 a year ago. The average list price for actives hit $2,391,918, up 8.16% year-over-year. That persistent gap between list prices and sale prices is the defining tension in this market, and it's why accurate pricing strategy matters more than ever.
Full MLS Data: July 2026 vs. July 2025
Complete month-over-month and year-to-date comparison from the Cape Cod & Islands MLS:
| Metric | Jul '26 | Jul '25 | % Chg | YTD '26 | YTD '25 | % Chg |
|---|---|---|---|---|---|---|
| Absorption Rate | 3.13 | 3.41 | -8.21% | 2.67 | 2.76 | -3.26% |
| Avg. List Price (Actives) | $2,391,918 | $2,211,394 | +8.16% | $1,517,182 | $1,476,027 | +2.79% |
| Median List Price (Actives) | $989,500 | $875,000 | +13.09% | $769,000 | $785,000 | -2.04% |
| Avg. Sale Price (Solds) | $1,265,797 | $1,270,953 | -0.41% | $1,085,375 | $1,009,014 | +7.57% |
| Median Sale Price (Solds) | $712,500 | $789,500 | -9.75% | $710,000 | $711,000 | -0.14% |
| Avg. CDOM | 44 | 51 | -13.73% | 54 | 51 | +5.88% |
| Median CDOM | 19 | 15 | +26.67% | 23 | 20 | +15.00% |
Source: Cape Cod & Islands Association of REALTORS® MLS, July 2026.
Homes Selling Faster Than in June — But Slower Than Last Year
Average cumulative days on market dropped to 44 days in July 2026 — a 13.7% improvement from 51 days in July 2025, and a meaningful step down from June 2026's 51-day average. That's an encouraging sign that the summer selling season is generating real buyer urgency for well-priced properties.
The median CDOM tells a more nuanced story: at 19 days, it's up 26.7% from 15 days in July 2025. The divergence between average and median CDOM suggests a two-speed market — correctly priced homes are moving in two to three weeks, while overpriced listings are dragging the average upward as they sit. The YTD average CDOM of 54 days (up 5.9% from 51 in 2025) confirms that the overall pace of the market remains slower than a year ago, even with July's improvement.
The takeaway for sellers: pricing discipline is the single biggest lever you control. Homes that enter the market at a realistic price are still finding buyers within three weeks. Homes that don't are sitting — and sitting costs money.
Absorption Rate Eases — Market Gradually Rebalancing
The absorption rate slipped to 3.13 in July 2026, down 8.21% from 3.41 in July 2025. An absorption rate above 1.0 still indicates a seller's market, so Barnstable hasn't flipped to buyer's market territory — but the trend is clear. The YTD absorption rate of 2.67 (down 3.26% from 2.76 in 2025) reinforces that the balance of power is gradually shifting toward buyers.
What does this mean in practice? Sellers in the $600K–$900K range are facing more competition from other listings and more scrutiny from buyers than at any point in the past two years. The luxury segment — properties above $1.5M — continues to attract demand from out-of-state buyers and Boston-area second-home purchasers, which is why the average sale price has held up even as the median has softened.
For Sellers
Closed sales are up 15.4% and pending contracts jumped 22.6% — buyer demand is real. But the median sale price fell 9.75% while median list prices climbed 13%. That gap is the problem. Homes priced to the market are moving in under three weeks. Homes priced to wishful thinking are sitting. Get a current comparative market analysis before you list.
Read the Seller GuideFor Buyers
Active inventory fell 13.9% year-over-year to 142 listings, but 60 new properties entered the market in July alone. The YTD median sale price of $710,000 is essentially flat — this is not a runaway market. With pending contracts surging, the best homes are still moving fast. Get pre-approved and be ready to act when the right property appears.
Read the Buyer GuideWhere the Volume Is: Price Band Breakdown
Looking at the July sold listings by price band, the $600K–$649K range led all segments with 11 closings — the most active price point in the market. The $550K–$599K range followed with 7 closings, and the $650K–$699K range added 3 more. Together, the $550K–$699K corridor accounted for 21 of 60 July closings — 35% of all transactions.
At the upper end, the $4.25M–$4.5M range saw 2 closings (up from zero a year ago), and the $5M+ segment recorded 2 sales — matching July 2025's pace. The luxury market is active but not accelerating. The real story in July was the mid-market finding buyers, which is consistent with the 15.4% increase in total closed sales.
On the pending side, the $700K–$749K range led with 7 contracts, followed by $750K–$799K with 5 and $950K–$999K with 5. The $5M+ segment had 4 pending contracts — the strongest luxury pipeline we've seen in recent months.
What to Watch in August and Fall 2026
July's data paints a picture of a market that is more active than it was in June, but still navigating the tension between seller expectations and buyer reality. The 22.6% surge in pending contracts is the most forward-looking positive signal in the report — it points to a healthy August closing volume and suggests that buyers who were on the sidelines in spring are now moving.
The YTD average sale price of $1,085,375 is up 7.57% over 2025 — solid appreciation driven by the luxury segment. The YTD median of $710,000 is essentially flat, which is a healthy outcome in a high-interest-rate environment. Barnstable is not experiencing the price corrections seen in some other markets; it's experiencing a normalization after two years of pandemic-era frenzy.
As the summer season winds down and the fall market approaches, the key variable will be whether sellers adjust list prices to reflect where buyers are actually transacting. The data is clear: the market will reward realistic pricing and punish overpricing. If you're thinking about listing this fall — or buying before the end of the year — now is the time to get a current read on your specific village and price range.
Wood Real Estate
Serving Barnstable and all of Cape Cod. Data sourced from Cape Cod & Islands MLS, July 2026. Questions about what this report means for your home or your search? We're here to help.